
Table of Contents
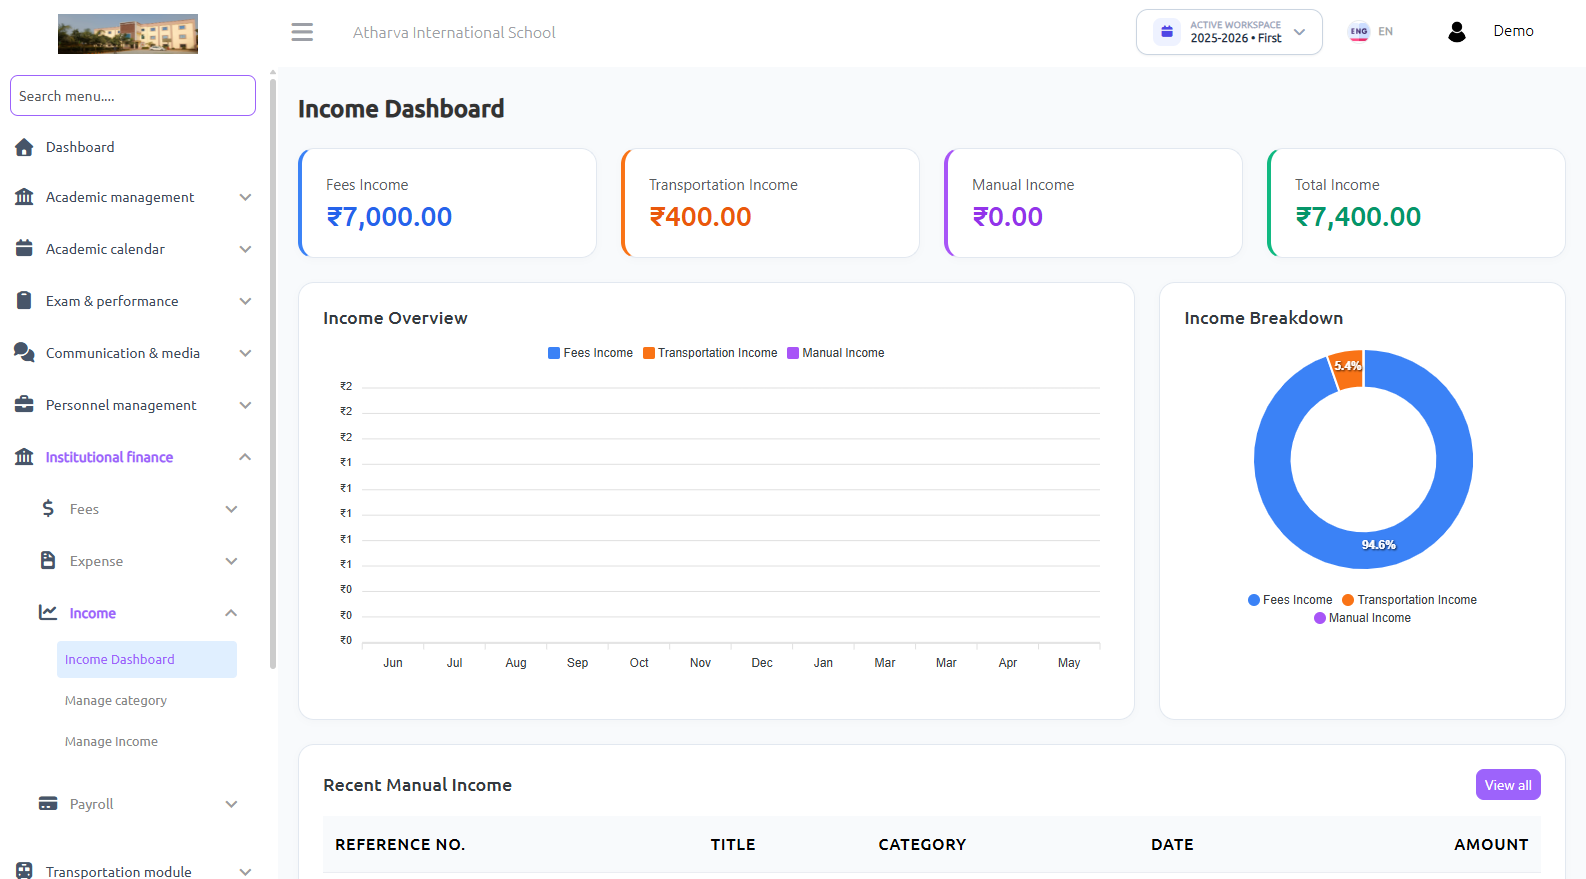
The Income Dashboard provides a centralized, visual suite for tracking all revenue sources entering the school—ranging from automated student fee collections to manual operational income.
Overview & Key Features #
- Multi-Source Revenue Tracking: Automatically aggregates Fees Income, Transportation Income, and Manual Non-Fee Income.
- Comprehensive Income Dashboard: Visual analytics featuring key metric cards, month-by-month stacked bar charts, and revenue distribution donut charts.
- Granular Search & Filters: Search income records by session year, category, month, reference number, or title.
- Audit Transparency: Tracks which administrator or staff member recorded each manual income entry.
Dashboard Widgets Explained #
Financial Summary Cards #
- Fees Income: Total compulsory & optional tuition/academic fees collected.
- Transportation Income: Total transportation/bus fees collected from students.
- Manual Income: Total non-fee operational income recorded manually.
- Total Income: Combined grand total of all revenue sources.
Income Overview (Monthly Bar Chart) #
A month-by-month stacked bar chart illustrating revenue trends across the academic session year.
Income Breakdown (Distribution Donut Chart) #
Visual breakdown showing percentage contributions of each income stream relative to total revenue.
Recent Manual Income Table #
Quick view of the latest manual income transactions with reference numbers, titles, categories, dates, and amounts.


